ABCD
California
{{Title text: 58% of the state has gone into plaid.}}
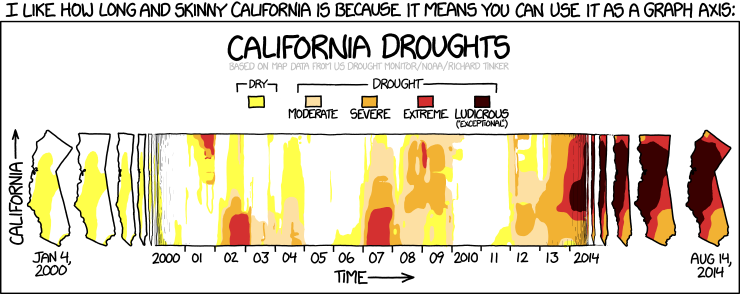
I like how long and skinny California is because it means you can use it as a graph axis:
California Droughts
Based on map data from US drought monitor
NOAA
Richard Tinker
((Scale: Dry, moderate, severe, extreme, ludicrous (exceptional) going from yellow to orange to red to black))
((California map data showing drought from Jan 4, 2000 to Aug 14, 2014 with the state squished in between))
58% of the state has gone into plaid.